Commercial Energy Auditing

Your Building
Is Leaking.
We'll Show You
Where.

23%

average reduction in utility costs across our last 140 commercial audits
140+
Audits completed
$4.2M
Client savings identified
48hr
Report turnaround
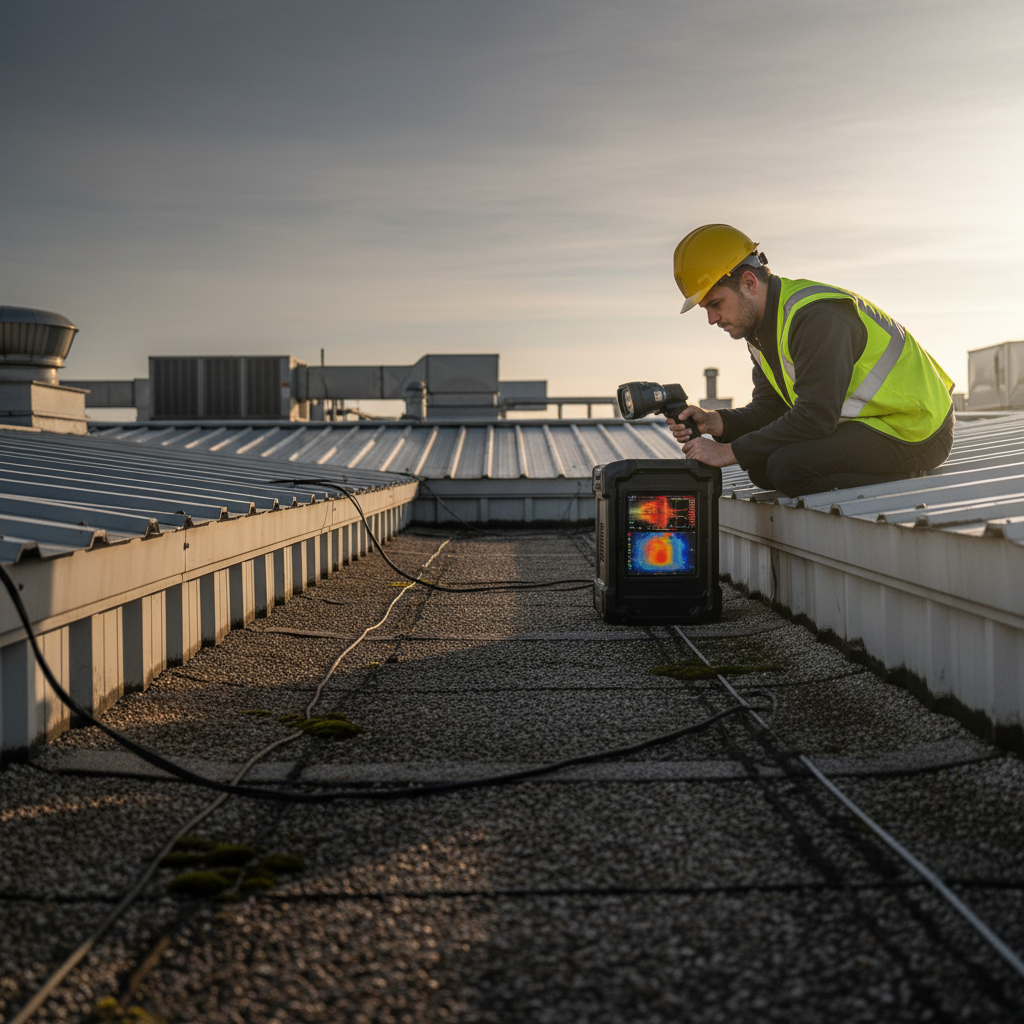
Energy auditor in high-visibility vest pressing thermal imaging camera against commercial roofline at dawn, steel-gray sky behind
Heat loss detected
847K
BTUs / day · Roof assembly
↑ 34% above benchmark
Phase 01

The Envelope:
Where Heat Meets Sky

Before we touch a single piece of mechanical equipment, we map every surface the building presents to the weather. Rooflines. Walls. Windows. Doors. Each one a potential deficit on your energy balance sheet.
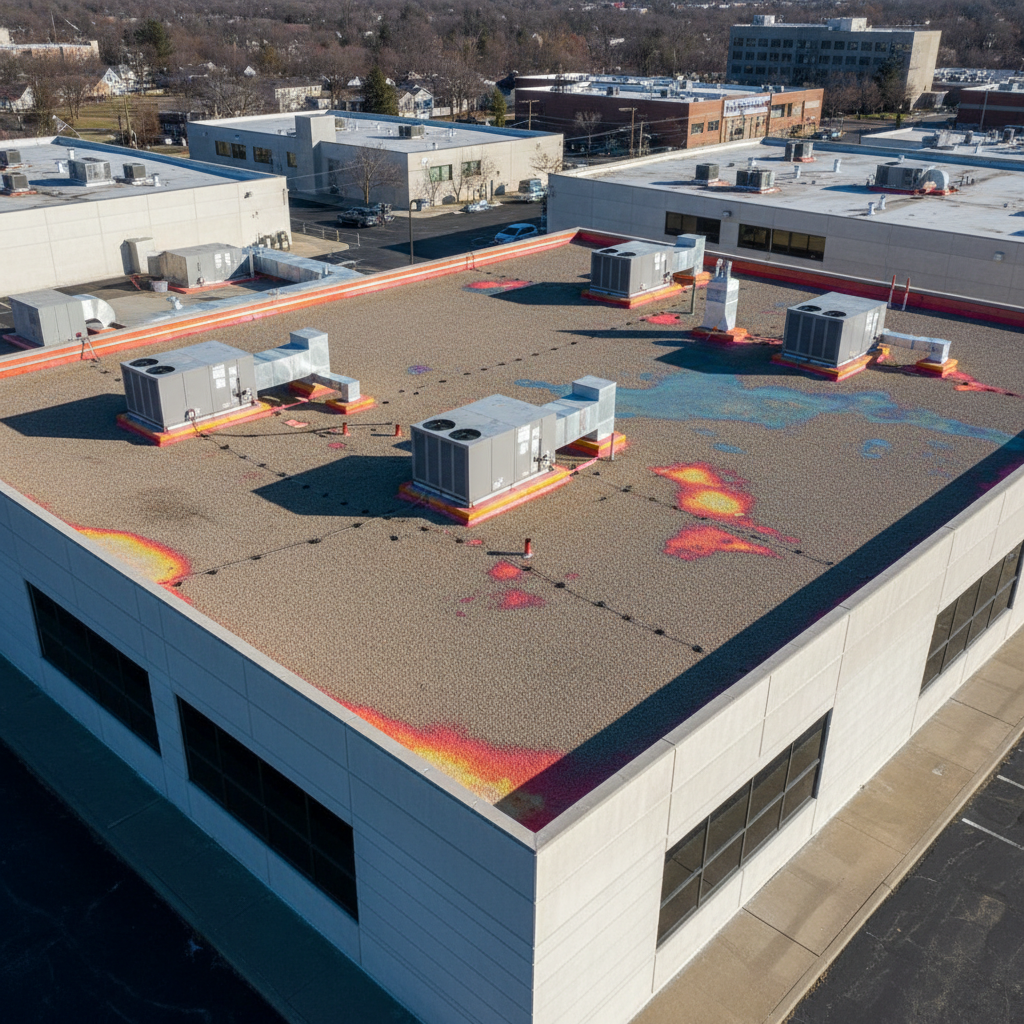
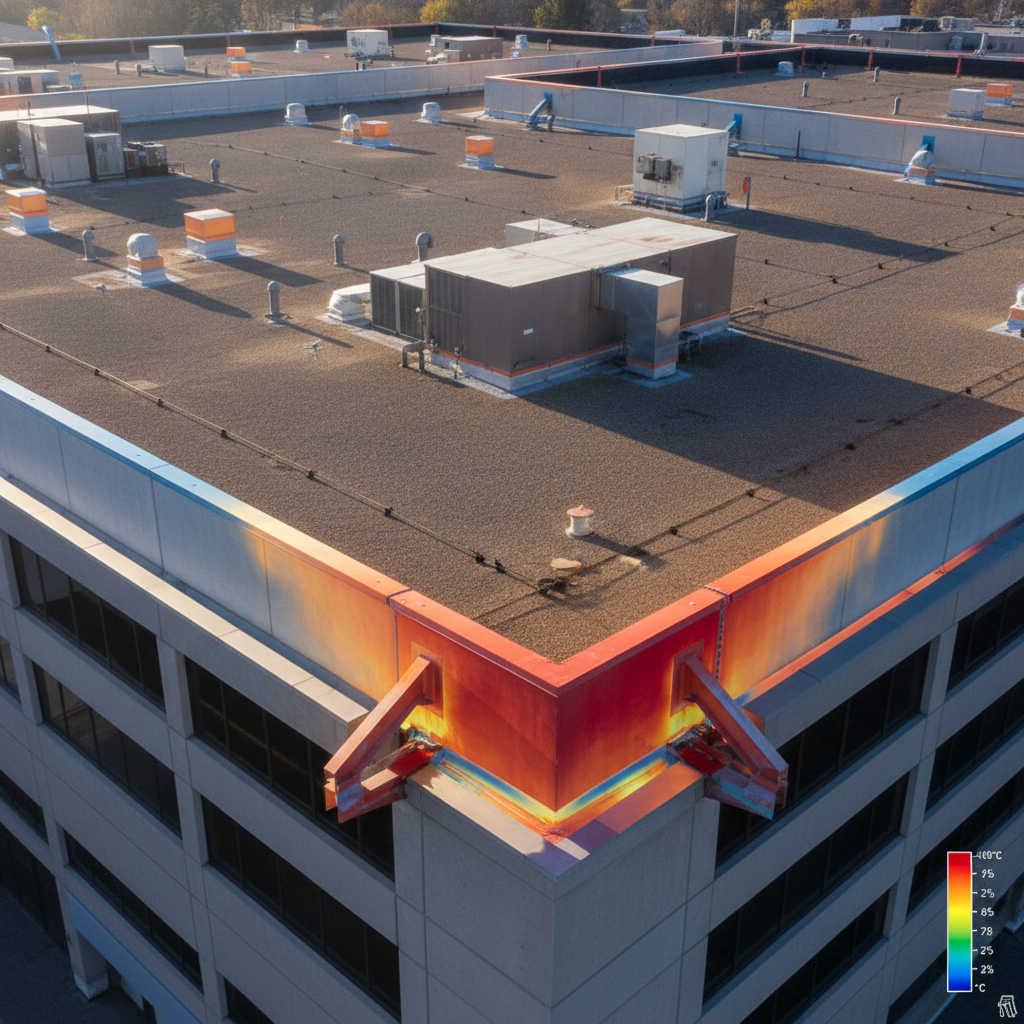
Aerial view of commercial flat rooftop showing HVAC units and parapet walls with heat loss visible in thermal scan
Roofline Assembly
Thermal bridging at parapet cap
34% above benchmark
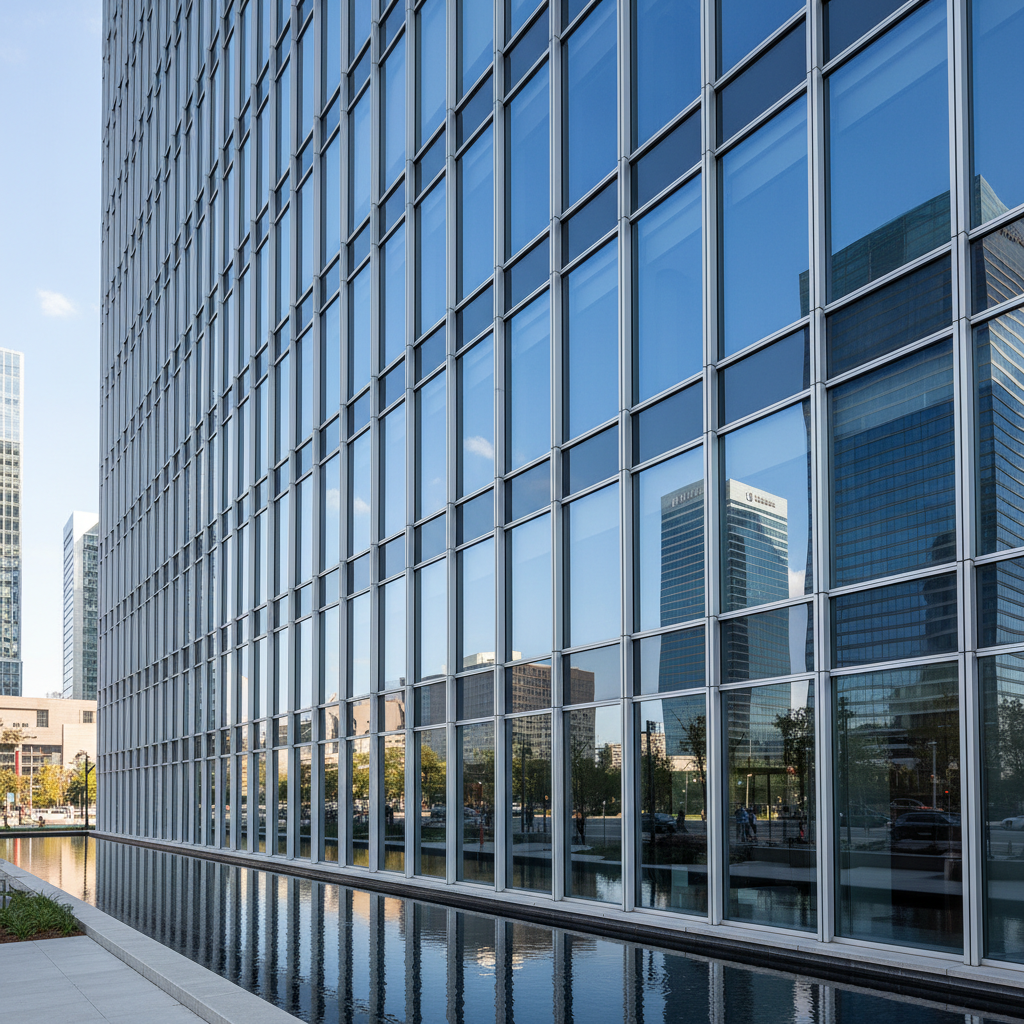
Commercial building glass curtain wall facade showing window mullion joints and glazing system
Curtain Wall System
Gasket failure at mullion joints
18% infiltration increase
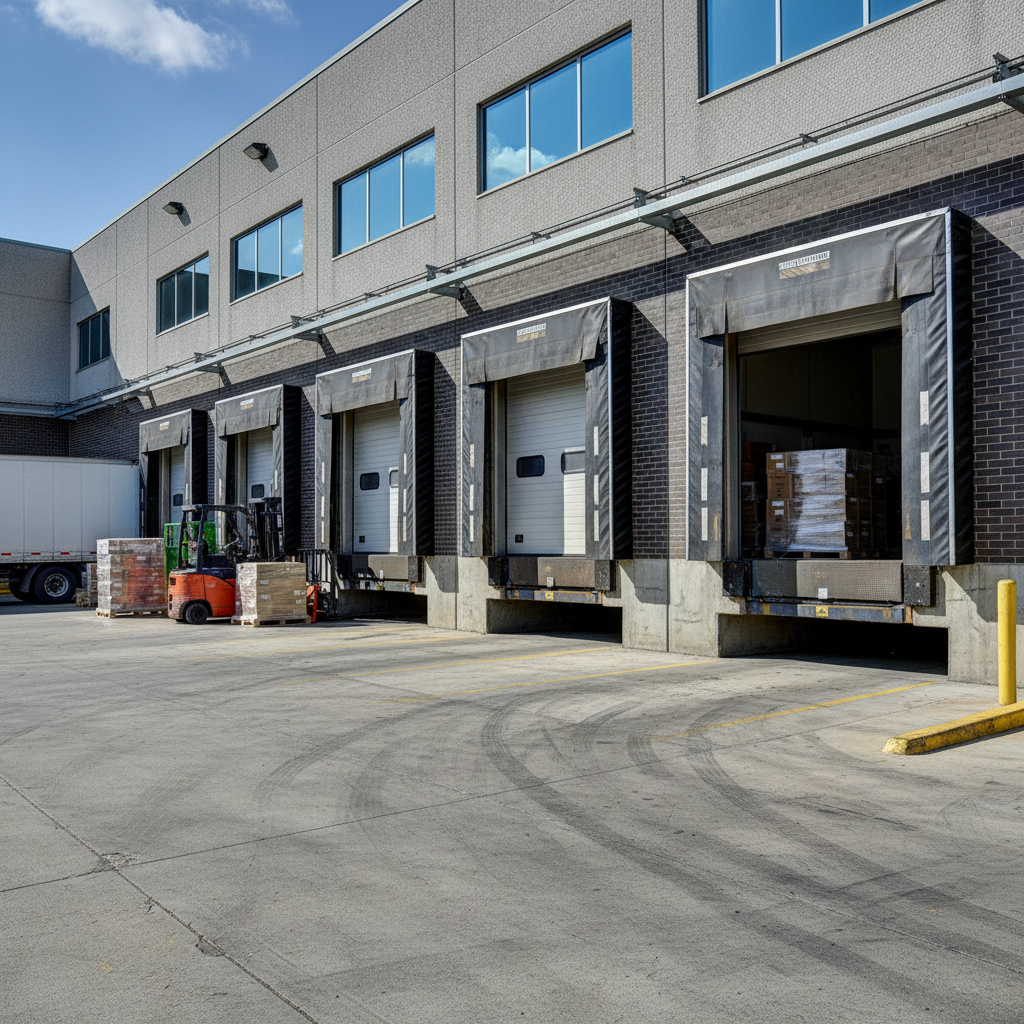
Commercial building loading dock with large overhead doors and concrete dock levelers
Loading Dock Doors
Missing threshold seals
210K BTUs / hr uncontrolled
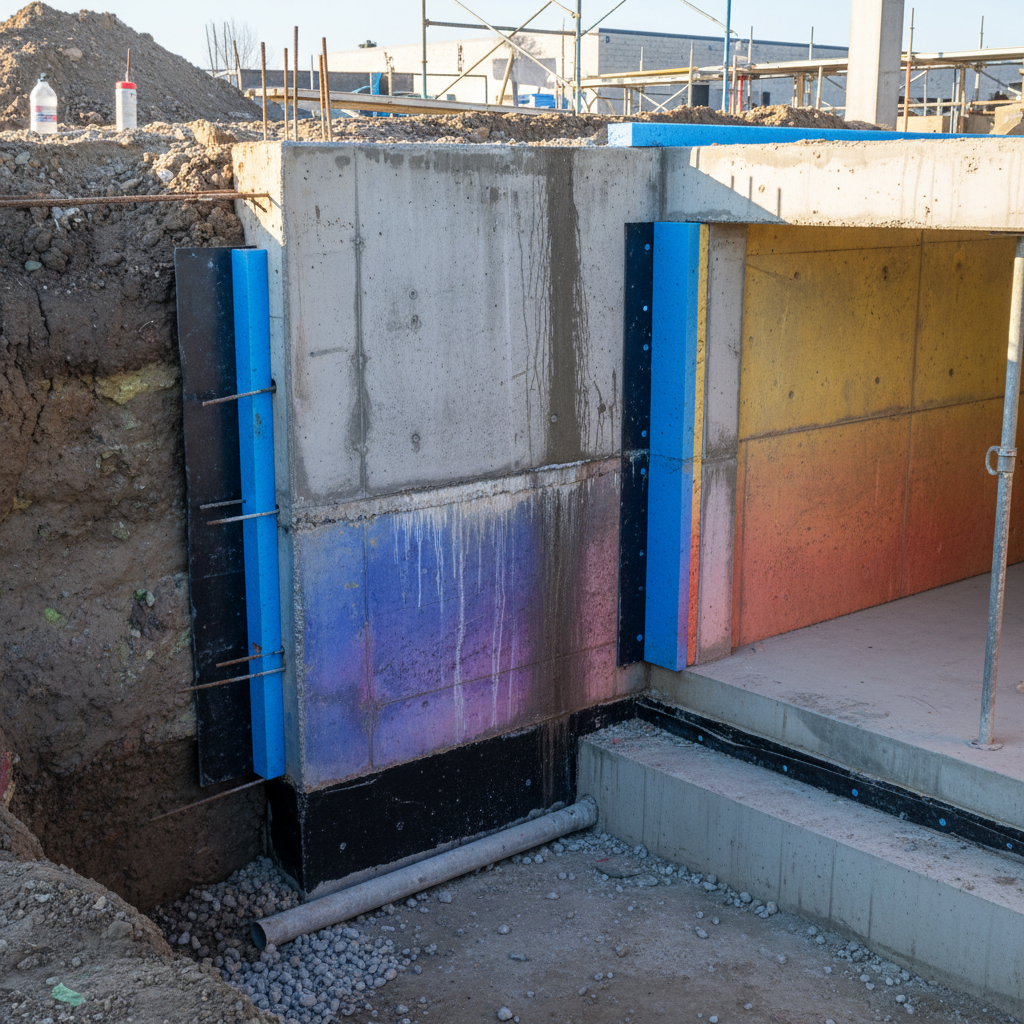
Commercial building foundation and below-grade concrete wall showing moisture and thermal characteristics
Below-Grade Foundation
Vapor drive through slab edge
9% cooling load increase

In 87% of commercial buildings we audit, envelope losses account for more than half of total energy waste — yet most HVAC upgrades miss them entirely.

Schedule Your Walkthrough
Phase 02

Mechanical Systems:
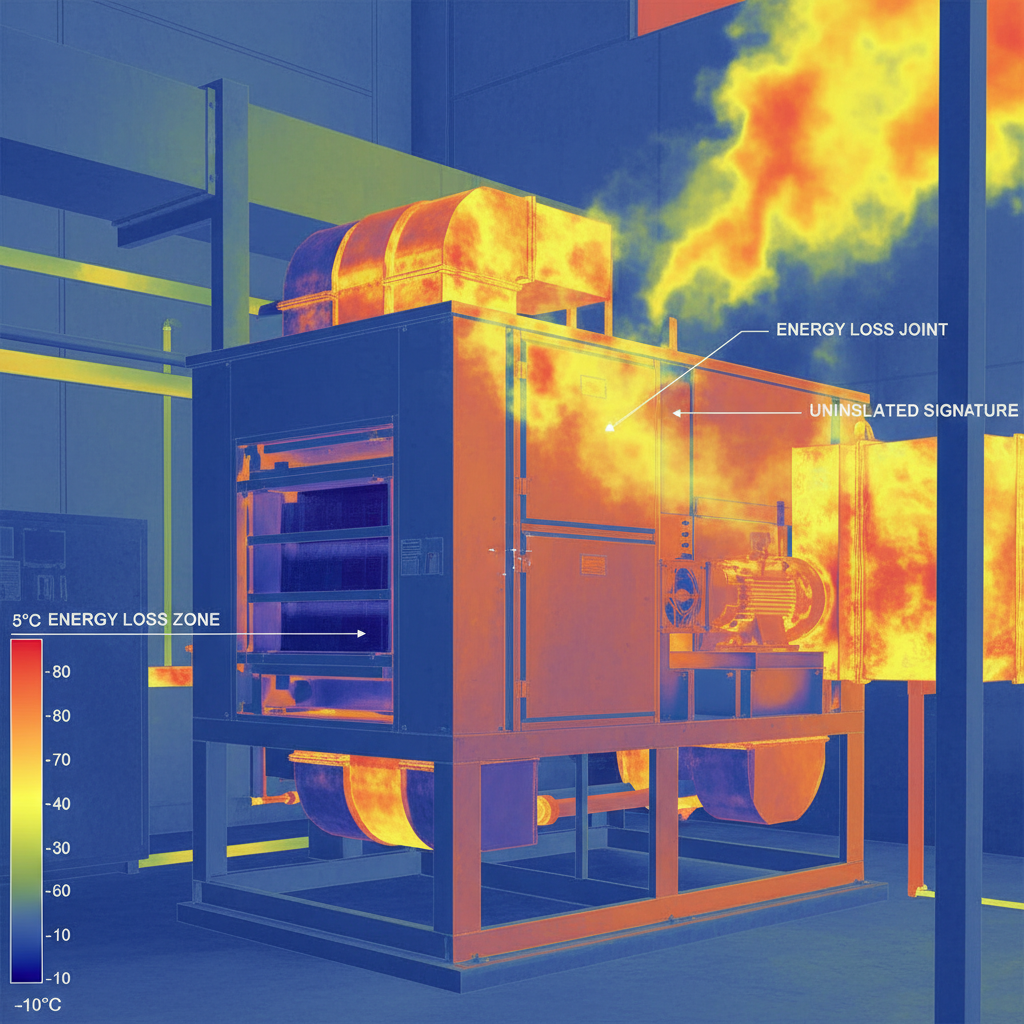
The Engine Room

The envelope defines how hard the mechanical system has to work. These systems define how efficiently it does the work. Both halves must be examined together.
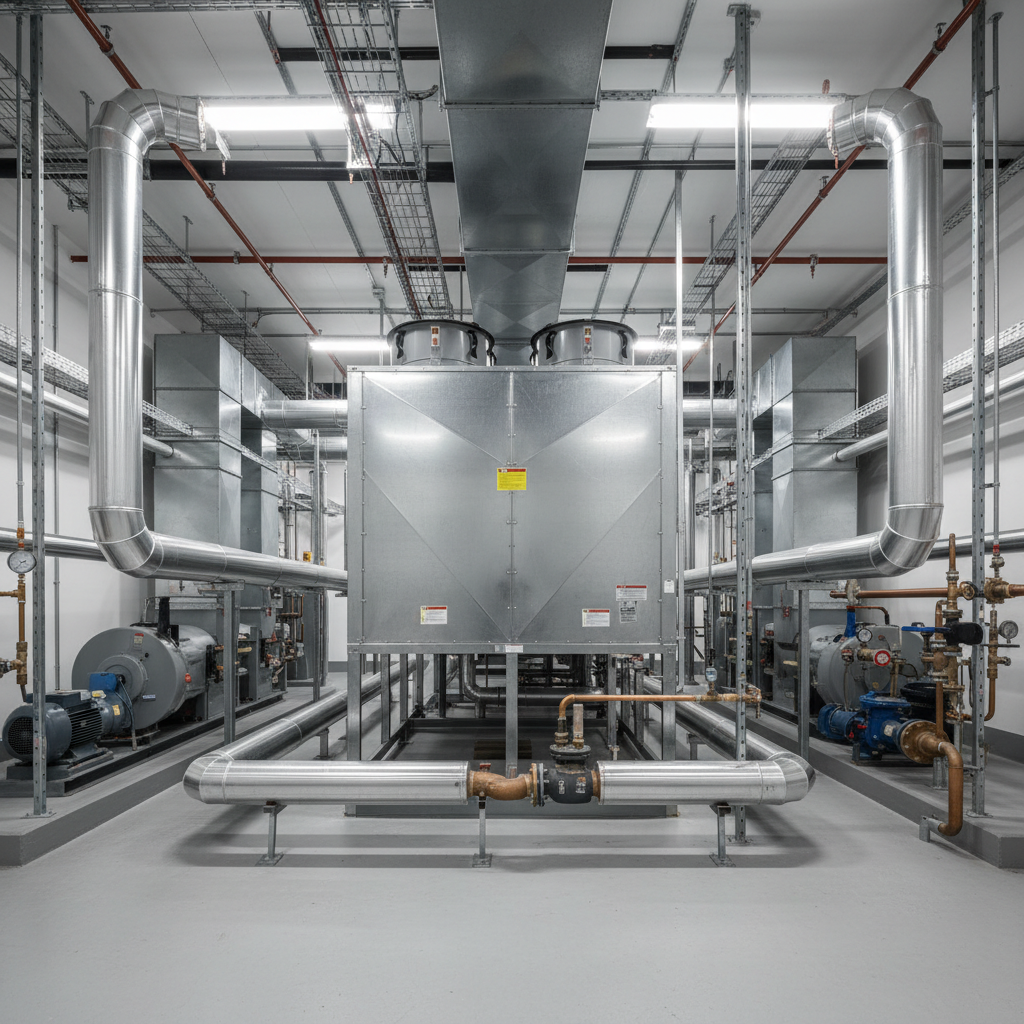
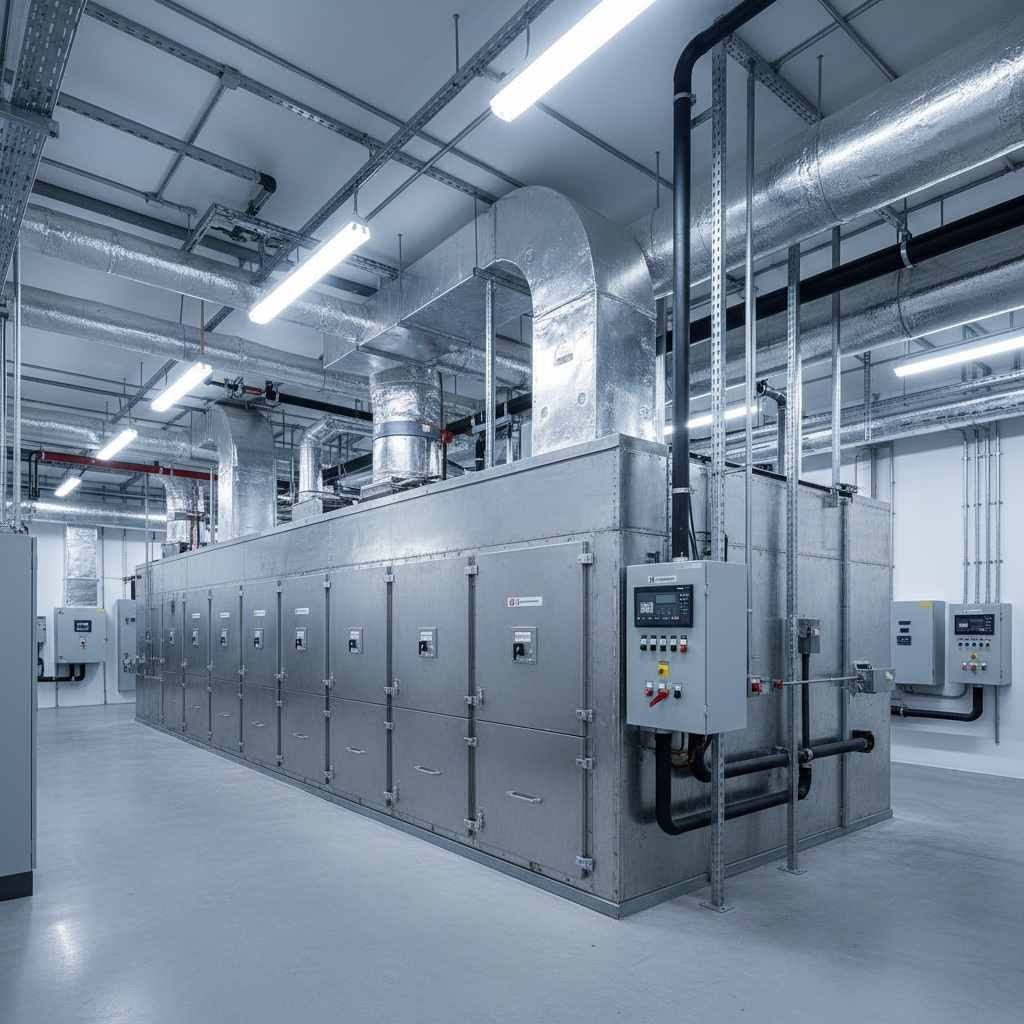
Commercial HVAC rooftop unit with ductwork and mechanical systems in industrial building plant room
Live stack temp
412°F
Target: ≤ 350°F
Combustion analysis in progress
01

Air Distribution

Duct leakage & static pressure mapping

Leaky ducts in unconditioned spaces routinely waste 20–30% of HVAC output before air reaches the zone.

28%
avg. duct loss found
02

Boiler & Chiller Plant

Combustion efficiency & sequencing analysis

We measure stack temperature, O₂ levels, and part-load sequencing. A boiler running at 72% efficiency when 91% is achievable is a recoverable loss.

$18K
avg. plant savings identified
03

Controls & BAS

Setpoint drift, scheduling gaps, override audit

Occupied setpoints running 24/7. Economizer dampers stuck closed. Night-setback disabled. Controls failures are invisible on a utility bill — until we map them.

63%
of sites have active overrides
Phase 03

The Report:
Invisible Made Undeniable

Every finding is photographed, annotated, and mapped to a dollar figure. You'll see exactly where the heat escapes — in color, on a floor plan, with a recommended fix and a projected ROI.
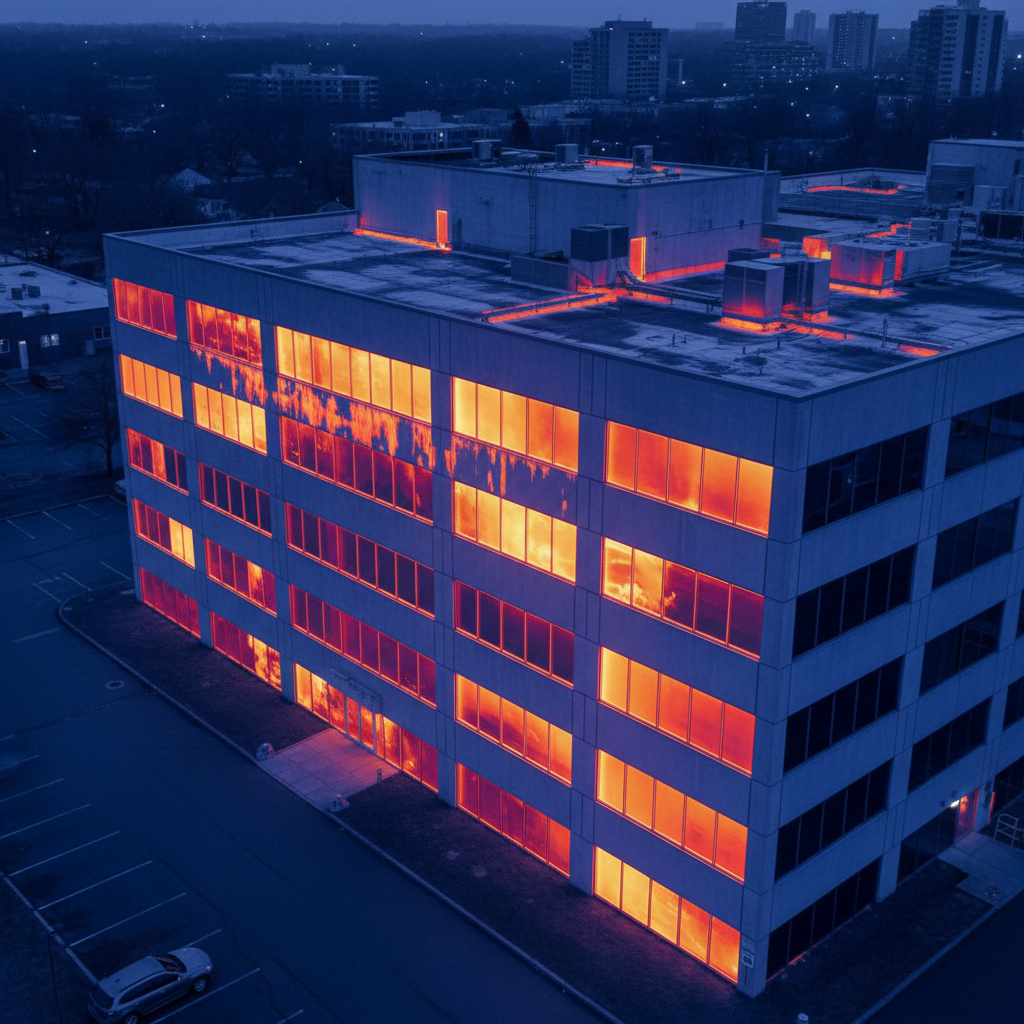
Thermal infrared camera image of commercial building wall showing heat loss in orange and red gradients against cool blue background
+41°F above ambient
Thermal bridge: beam pocket
Ambient reference zone
°F
95°72°58°45°
Diagnostic Report
Westfield Office Complex
Audit date: Feb 14, 2026 · 6:42 AM
Thermal anomaly index14 findings
Estimated annual waste$62,400
Payback period (avg)2.1 years
ENERGY STAR gap18 pts
Priority Findings
01Roof membrane delamination — NE quadrantCritical
02AHU-3 economizer damper seized closedHigh
03Perimeter slab edge uninsulated — 3rd floorMedium
See a Full Report

Download a redacted sample audit report from a 180,000 sq ft office complex.

Email required · No spam · PDF, 24 pages

The Evidence

Numbers That Don't
Lie on Utility Bills
Total BTUs identified across all audits to date
0
BTUs / year · Recoverable
That's the equivalent of 0 kWh of electricity — waste that had no invoice, no meter, and no owner until we walked in with a camera.
Before & After · Thermal Imaging
Standard photograph of commercial building rooftop parapet wall before thermal audit inspection
Roof Parapet — Before
Standard photograph
Thermal infrared scan of commercial building rooftop parapet showing heat loss in orange and red colors
Roof Parapet — After
Thermal infrared scan
IR · 8–14μm
Standard photograph of air handling unit mechanical room before thermal inspection
AHU Plenum — Before
Standard photograph
Thermal infrared scan of air handling unit showing hot spots and energy loss patterns
AHU Plenum — After
Thermal infrared scan
IR · 8–14μm
"We'd been upgrading equipment for three years and our gas bill kept climbing. EnergyAudit walked the building in one day and found $94,000 in annual losses we'd never have found ourselves. The thermal images alone justified the audit fee."
Marcus Delgado, Facilities Director at Ridgeline Property Group
Marcus Delgado
Facilities Director · Ridgeline Property Group
2.4M sq ft managed · Denver, CO
$94K
Annual losses identified
14mo
Full payback achieved
ENERGY
STAR
Certification achieved
What Happens Next

Three Steps from
Suspicion to Certainty

A

Pre-Audit Intake

15-minute call. We review your utility history, building age, and primary concern — whether that's a certification deadline, a failing system, or a bill that stopped making sense.

B

On-Site Walkthrough

4–8 hours on site with thermal cameras, blower door, combustion analyzers, and duct pressurization equipment. We work around your operations.

C

Diagnostic Report

Delivered within 48 hours. Every finding photographed, annotated, prioritized by ROI. A roadmap — not a list of problems.

Savings Guarantee

If we don't identify energy savings that exceed our audit fee, you pay nothing. We've never had to honor that guarantee — but it stands.

Schedule Your
Walkthrough

Audits are scheduled 3–4 weeks out. Buildings under 50,000 sq ft typically complete in a single day.

Thermal imaging of full envelope
Blower door pressurization test
Mechanical system efficiency analysis
Controls and BAS review
48-hour diagnostic report
ROI-prioritized findings
Schedule Your Walkthrough →
140+
Audits
ASHRAE
Level II certified
48hr
Report time